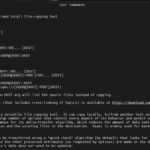
Advanced Linux Performance Tuning Tutorial with Examples
TL;DR: This Linux performance tuning tutorial with examples covers advanced monitoring, kernel tuning, disk I/O optimization, benchmarking, and real-world pitfalls. You’ll learn to use sysctl, perf, fio, and other essential tools to optimize Linux systems, all with practical, production-tested examples and critical security notes.
Introduction to Advanced Linux Performance Tuning
Performance tuning in Linux is an essential discipline for experienced system administrators and DevOps engineers. The difference between a well-tuned and a poorly tuned system can be measured in throughput, latency, and reliability—often the defining factors for production workloads. Tuning isn’t just about squeezing extra performance; it’s about understanding your workload, identifying bottlenecks, and applying targeted optimizations without compromising stability or security.
Linux provides a rich set of tools for monitoring resources, analyzing application behavior, and adjusting kernel and user-space parameters. Classic utilities like top, htop, vmstat, and iostat give you real-time insight into CPU, memory, and disk usage. Advanced utilities like perf and sysctl allow you to profile CPU usage to the function level and tweak kernel behavior on the fly.
WARNING: Performance tuning often requires root privileges. Always test changes in a non-production environment before applying system-wide.
Distro Notes:
- On RHEL/CentOS, install tools using
yumordnf(some in thesysstatpackage). - On Debian/Ubuntu, use
aptto installhtop,sysstat, and other tools. - For Arch Linux, everything is available via
pacman.
Common Mistakes:
- Changing kernel parameters without understanding their impact.
- Failing to collect baseline performance metrics before tuning.
- Applying “one size fits all” tuning guides without considering specific workloads.
RHEL 9 Directory Sharing: Complete Guide to Sharing Directories via Apache Web Server
TL;DR Summary
- Identify bottlenecks using monitoring tools like
top,htop,vmstat,iostat, andsar. - Tune system and kernel parameters with
sysctland/etc/sysctl.conf. - Optimize disk I/O using tools like
fioandiostatand adjust filesystem mount options. - Profile applications with advanced utilities such as
perf,strace, andlsof. - Always benchmark before and after making changes to validate impact.
Key Commands and Examples
# Example 1: List all sysctl kernel parameters with their current values
$ sysctl -a
kernel.ostype = Linux
kernel.osrelease = 5.10.0-20-amd64
...
Helps you inventory all tunable kernel parameters and their current values.
# Example 2: Monitor detailed disk I/O stats, refreshing every second
$ iostat -xz 1
Device    r/s   w/s    rkB/s   wkB/s ... %util
sda       10    5      1024    512   ... 23.45
...
Shows per-disk I/O, average request size, and utilization—critical for spotting disk bottlenecks.
# Example 3: Profile live CPU usage by kernel function
$ perf top
  29.75%  [kernel]  [k] copy_user_generic_string
  14.02%  [kernel]  [k] native_write_msr_safe
...
Instantly reveals which functions are consuming CPU cycles.
# Example 4: Check memory usage trends
$ vmstat 1 5
procs ---------memory---------- ---swap-- -----io---- -system-- ------cpu-----
 r  b   swpd   free   buff  cache   si   so    bi    bo   in   cs us sy id wa st
 1  0      0 120000  50000 200000    0    0     1     2   10   20  5  1 94  0  0
...
Provides a rolling snapshot of memory, swap, and CPU usage.
# Example 5: List open files for nginx processes
$ lsof -u nginx
nginx   1234 nginx  txt  REG ... /usr/sbin/nginx
...
Useful for tracking resource usage and troubleshooting file descriptor exhaustion.
Distro Notes:
- Some tools (
perf,fio) may require extra packages (linux-tools-$(uname -r)on Ubuntu/Debian). - On RHEL/CentOS,
sysstatprovidesiostatandsar. - Remember to install what’s missing before beginning.
WARNING: Profiling tools like
perfandstracecan impact system performance and may expose sensitive data. Use with caution, especially on production systems.
Common Mistakes:
- Neglecting to install required packages for advanced tools.
- Misinterpreting output without proper context or understanding.
- Running profiling tools in production without appreciating the resource overhead.
Complete Guide to Use Rsync in Linux
Prerequisites for Performance Tuning
Advanced Linux performance tuning isn’t just about knowing which command to run. Preparation and safety are vital:
- Root or sudo access is often required to adjust system parameters and run advanced profiling tools.
- Backups of all configuration files you’ll modify—accidental misconfiguration can brick a system or leave it unstable.
- Baseline performance metrics so you can measure improvement or rollback if needed.
- A clear understanding of your workload and hardware—tuning for a database server is very different from a file server or application host.
Essential Commands and Examples
# Example 1: Back up sysctl configuration before changes
$ sudo cp /etc/sysctl.conf /etc/sysctl.conf.bak
Ensures you can easily revert kernel tweaks if needed.
# Example 2: Archive nginx logs prior to tuning, preserving operational history
$ sudo tar czvf /var/backups/nginx-logs-$(date +%F).tar.gz /var/log/nginx/
Prevents accidental log loss and helps with after-the-fact troubleshooting.
# Example 3: Verify sudo privileges for this session
$ sudo -l
User sysadmin may run the following commands on web01:
    (ALL) ALL
Confirms you have the required access before making system changes.
# Example 4: Collect baseline CPU stats for later comparison
$ mpstat -P ALL 1 5
Linux 5.10.0-20-amd64 (db01)   06/01/2024    _x86_64_   (8 CPU)
...
Captures per-CPU utilization over a short sample window.
# Example 5: Snapshot running processes for reference
$ ps aux > /var/backups/ps-aux-$(date +%F).txt
Helps compare process state pre- and post-tuning.
Distro Notes:
- Minimal RHEL/CentOS installs may lack
sudo—install viayum install sudo. mpstatis found in thesysstatpackage (apt install sysstatoryum install sysstat).
WARNING: Always verify your backups before making changes. Never tune production environments without a tested rollback plan.
Common Mistakes:
- Skipping configuration backups—risking hard-to-recover misconfigurations.
- Failing to collect baseline data, making it impossible to judge the effect of changes.
- Assuming sudo/root access is available on all target systems—always verify.
Linux Security Hardening for Servers Tutorial
Common Mistakes & Gotchas in Linux Performance Tuning
Even seasoned admins can fall prey to these traps. Recognizing these common mistakes can save you hours of troubleshooting and prevent costly outages.
Real-World Examples
# Example 1: Setting a kernel parameter at runtime (not persistent after reboot)
$ sudo sysctl -w vm.swappiness=10
vm.swappiness = 10
Effective immediately, but will revert on reboot unless added to /etc/sysctl.conf.
# Example 2: Typo in sysctl.conf—parameter silently ignored
$ echo "vm.swappines=10" | sudo tee -a /etc/sysctl.conf
The correct parameter is vm.swappiness; this typo will be ignored without error.
# Example 3: Remounting /tmp with `noexec` (may break applications that execute from /tmp)
$ sudo mount -o remount,noexec /tmp
Some applications expect to execute binaries/scripts from /tmp—test thoroughly before applying.
# Example 4: Overcommitting memory without understanding impact
$ echo 1 | sudo tee /proc/sys/vm/overcommit_memory
Can cause OOM (Out-Of-Memory) kills if not paired with proper swap and process controls.
# Example 5: Setting ulimit too low for a web server
$ ulimit -n 1024
May lead to ‘too many open files’ errors under load—always match to expected workload.
Distro Notes:
- Kernel parameter names may differ slightly between major distros or kernel versions.
ulimitis a shell built-in; syntax can vary between bash, sh, and other shells.
WARNING: Misconfigured kernel parameters or mount options can destabilize your system or open security holes.
Common Mistakes:
- Changing parameters at runtime only—settings reset after reboot.
- Typos in configuration files result in silent failures.
- Applying settings without understanding workload impact or application requirements.
Advanced Techniques for Linux Performance Optimization
Beyond the basics, these advanced strategies let you squeeze the most out of your hardware. With careful application, you can achieve significant gains in throughput and responsiveness.
Kernel Tuning with sysctl
# Example 1: Lower swappiness to reduce swap usage and prioritize RAM
$ sudo sysctl -w vm.swappiness=10
vm.swappiness = 10
Reduces kernel’s tendency to swap out process memory—useful for RAM-heavy applications.
TIP: To make this persistent, add
vm.swappiness=10to/etc/sysctl.confand reload withsudo sysctl -p.
System Tuning Profiles with tuned
# Example 2: Apply the 'throughput-performance' profile for disk/network-intensive workloads (RHEL)
$ sudo tuned-adm profile throughput-performance
Automates kernel and sysctl tweaks for high-throughput servers.
NOTE:
tunedis standard on RHEL/CentOS, but optional on Debian/Ubuntu (apt install tuned).
Disk I/O Analysis with iostat
# Example 3: Monitor disk I/O with extended stats, refreshing every second
$ iostat -xz 1
Device    r/s   w/s    rkB/s   wkB/s ... %util
nvme0n1   50    40     20480   16384 ... 97.00
...
Look for high %util or large await times—signs of I/O bottlenecks.
Real-Time CPU Profiling with perf
# Example 4: Profile CPU usage by kernel and user-space functions
$ sudo perf top
  41.92%  [kernel]  [k] copy_user_generic_string
  20.15%  java      [.] JavaThread::run
...
Pinpoints “hot” functions for application optimization.
Disk Benchmarking with fio
# Example 5: Run a random read/write performance test on disk
$ fio --name=randrw --rw=randrw --size=2G --numjobs=4 --time_based --runtime=60s --group_reporting
randrw: (groupid=0, jobs=4): err= 0: pid=12345: Fri Jun 1 15:10:10 2024
  read: IOPS=4200, BW=16.4MiB/s (17.2MB/s)(960MiB/60001msec)
  write: IOPS=4200, BW=16.4MiB/s (17.2MB/s)(960MiB/60001msec)
...
Generates heavy random disk I/O to simulate real-world database or VM workloads.
Process Prioritization with nice/renice
# Example 6: Start nginx with lower CPU priority (nice value 10)
$ nice -n 10 systemctl start nginx
Ensures nginx runs with lower scheduling priority, freeing up CPU for more critical processes.
# Example 7: Lower priority of a running process (PID 1234)
$ sudo renice +10 1234
1234 (process ID) old priority 0, new priority 10
Dynamically adjusts process scheduling without restarting.
Distro Notes:
tunedis default on RHEL/CentOS, optional elsewhere.perfmay require debug symbols for full stack traces.fiomust be manually installed on most distros.
WARNING: Tools like
perfandfiocan consume significant system resources—avoid running heavy tests on live production workloads.
Common Mistakes:
- Forgetting to make sysctl changes persistent—use
/etc/sysctl.conf. - Running disk benchmarks on production disks, risking service impact.
- Applying tuning profiles without validating their effect on your specific application.
Linux Performance Tuning: Real-World Scenarios Explained
Security & Production Considerations in Performance Tuning
Security and stability must never be sacrificed for raw performance. Tuning often involves modifying kernel parameters, changing filesystem mount options, or adjusting security modules like SELinux and AppArmor. Each of these comes with its own risks, and overlooking them can expose your system to vulnerabilities.
Security-Focused Examples
# Example 1: Check if SELinux is enforcing (RHEL/CentOS)
$ getenforce
Enforcing
Ensures mandatory access controls are in place.
# Example 2: Temporarily set SELinux to permissive (for troubleshooting only)
$ sudo setenforce 0
Disables enforcement but logs denials—never leave in permissive mode after testing.
# Example 3: Audit changes to sysctl.conf (track who changed kernel parameters)
$ sudo auditctl -w /etc/sysctl.conf -p wa
Enables auditing for writes and attribute changes.
# Example 4: List all current audit rules
$ sudo auditctl -l
-w /etc/sysctl.conf -p wa
...
Review what files/directories are being audited.
# Example 5: Restore SELinux enforcing mode
$ sudo setenforce 1
Reapplies strict security after tuning.
Distro Notes:
- SELinux is the default MAC system on RHEL/CentOS; Ubuntu uses AppArmor.
auditdmay not be enabled by default—install withyum install auditorapt install auditd.
WARNING: Leaving SELinux or AppArmor disabled after troubleshooting exposes your system to privilege escalation. Always re-enable after tuning.
Common Mistakes:
- Forgetting to re-enable SELinux/AppArmor after troubleshooting.
- Not auditing changes to critical system files.
- Overlooking the security implications of performance-related changes (e.g., relaxing memory limits or file descriptor caps).
Complete Guide to Use Rsync in Linux
Monitoring and Benchmarking Linux Performance
Effective tuning is impossible without measurement. Linux provides a rich ecosystem of tools for both real-time monitoring and post-mortem analysis. By leveraging these utilities, you can validate the impact of your changes and ensure your optimizations are truly beneficial.
Essential Monitoring and Benchmarking Examples
# Example 1: Historical CPU usage with sar
$ sar -u 1 5
Linux 5.10.0-20-amd64 (web01)   06/01/2024    _x86_64_   (4 CPU)
12:00:01 AM     CPU     %user     %nice   %system   %iowait    %idle
12:00:02 AM     all         4.00      0.00      2.00      1.00    93.00
...
Provides rolling CPU stats, ideal for spotting trends over time.
# Example 2: Real-time memory and swap stats
$ vmstat 1 5
procs ---------memory---------- ---swap-- -----io---- -system-- ------cpu-----
 r  b   swpd   free   buff  cache   si   so    bi    bo   in   cs us sy id wa st
 1  0      0 120000  50000 200000    0    0     1     2   10   20  5  1 94  0  0
...
Shows memory pressure, swapping, and IO in a compact format.
# Example 3: Per-CPU usage breakdown
$ mpstat -P ALL 1 5
Linux 5.10.0-20-amd64 (db01)   06/01/2024    _x86_64_   (8 CPU)
12:00:01 AM  CPU   %usr   %nice   %sys   %iowait   %irq   %soft   %steal   %guest   %gnice   %idle
12:00:01 AM    0      5       0      2         0      0       0        0        0        0      93
...
Useful for detecting imbalanced CPU loads or stuck processes.
# Example 4: Disk I/O benchmark simulating sequential writes
$ fio --name=seqwrite --rw=write --size=1G --bs=1M --numjobs=2 --group_reporting
seqwrite: (groupid=0, jobs=2): err= 0: pid=22345: Fri Jun 1 15:20:10 2024
  write: IOPS=1200, BW=75.0MiB/s (78.6MB/s)(1.0GiB/13614msec)
...
Measures maximum sequential write throughput—important for file servers and backup targets.
# Example 5: Real-time system stats with dstat, showing top CPU/memory consumers
$ dstat -cdnm --top-cpu --top-mem 1 5
----total-cpu-usage---- --dsk/total-- ---net/eth0- ---paging-- ---system-- --top-cpu-- --top-mem--
usr sys idl wai hiq siq| read  writ| recv  send|  in   out | int   csw |  PID usr sys|  PID mem
  5   1  94   0   0   0|   0     2 |   0     0 |   0     0 |  12    23 | 1042  3   0 |  997  2.1G
...
Consolidates multiple metrics in a single, real-time view.
Distro Notes:
sarandmpstatare part of thesysstatpackage.dstatis available via most package managers but may not be installed by default.
WARNING: Benchmarking tools like
fiocan generate heavy loads—schedule tests for maintenance windows, not during production peaks.
Common Mistakes:
- Running benchmarks on production hardware during peak hours.
- Misinterpreting short-lived spikes as trends.
- Not collecting enough samples for meaningful analysis—always benchmark before and after tuning.
Linux Performance Tuning: Real-World Scenarios Explained
Further Reading and Resources
- Red Hat Performance Tuning Guide
- Linux Performance by Brendan Gregg
- Linux Kernel Documentation: sysctl
- fio Documentation
- perf Documentation
In summary, this Linux performance tuning tutorial with examples equips you with practical, production-grade techniques for system monitoring, kernel tuning, disk optimization, and safe benchmarking. By understanding both the ‘why’ and ‘how’ behind each tool and tweak, you can confidently optimize your Linux systems for any workload—while keeping security and stability front of mind.